The release: an insurer weighs twenty years of mining losses
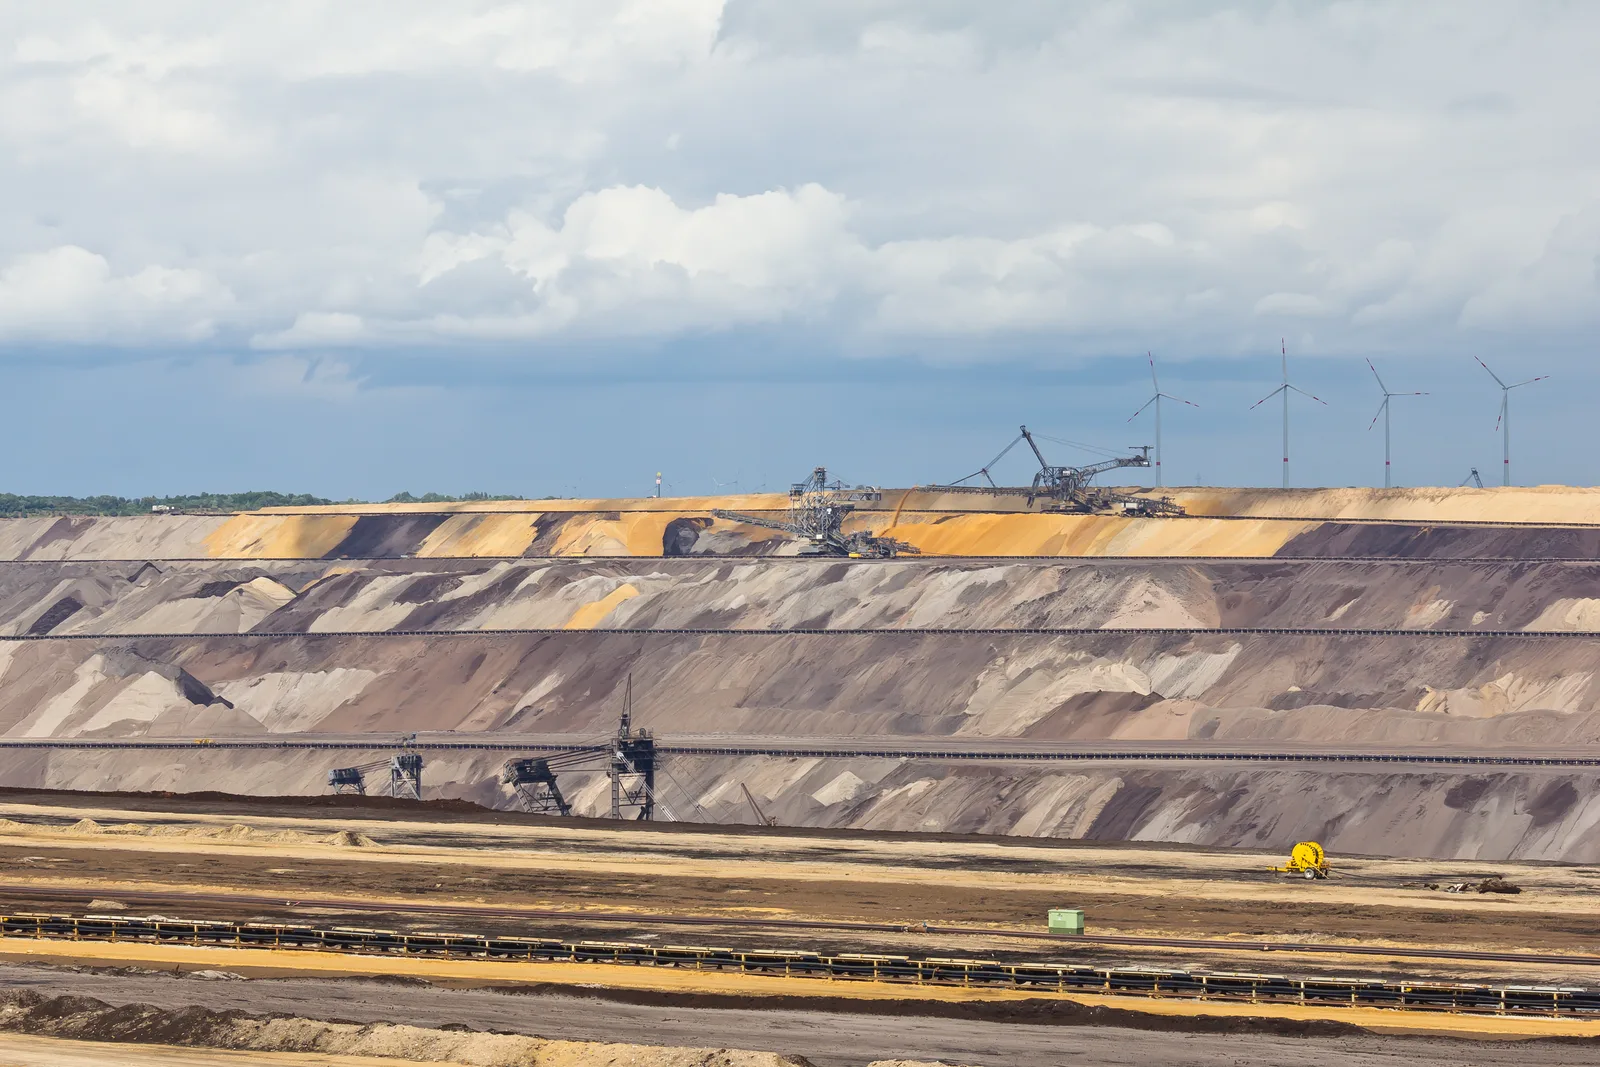
FM, the engineering-led property insurer, has published Understanding the Mining Industry: Loss Trends and Predictive Analytics, an analysis of global mining losses from 2006 to 2026 grounded in site-level engineering assessments at more than 300 mine sites; Australian Mining reported the release on 27 October 2026. The gross loss total across that twenty-year window is about US$2 billion, and two percentages headline the report. Fire is the single largest driver of loss severity, at roughly 32 per cent of total gross loss value — ahead of structural failure, electrical breakdown and mechanical breakdown. Ranked instead by equipment type, conveyors account for 32 per cent of equipment-related losses by value, ahead of heavy-duty mobile equipment (21 per cent), motors (16 per cent) and mills (15 per cent). The matching numbers are a coincidence of rounding, not the same statistic: one divides all mining loss value by cause, the other divides equipment loss value by asset class, and quoting either as the other is the first error to avoid. For conveyor buyers, the message survives the distinction — by value, no equipment class loses more money, and the mechanism that turns equipment failures into headline losses is most often fire.
Why conveyors top the table: escalation, not breakdown counts
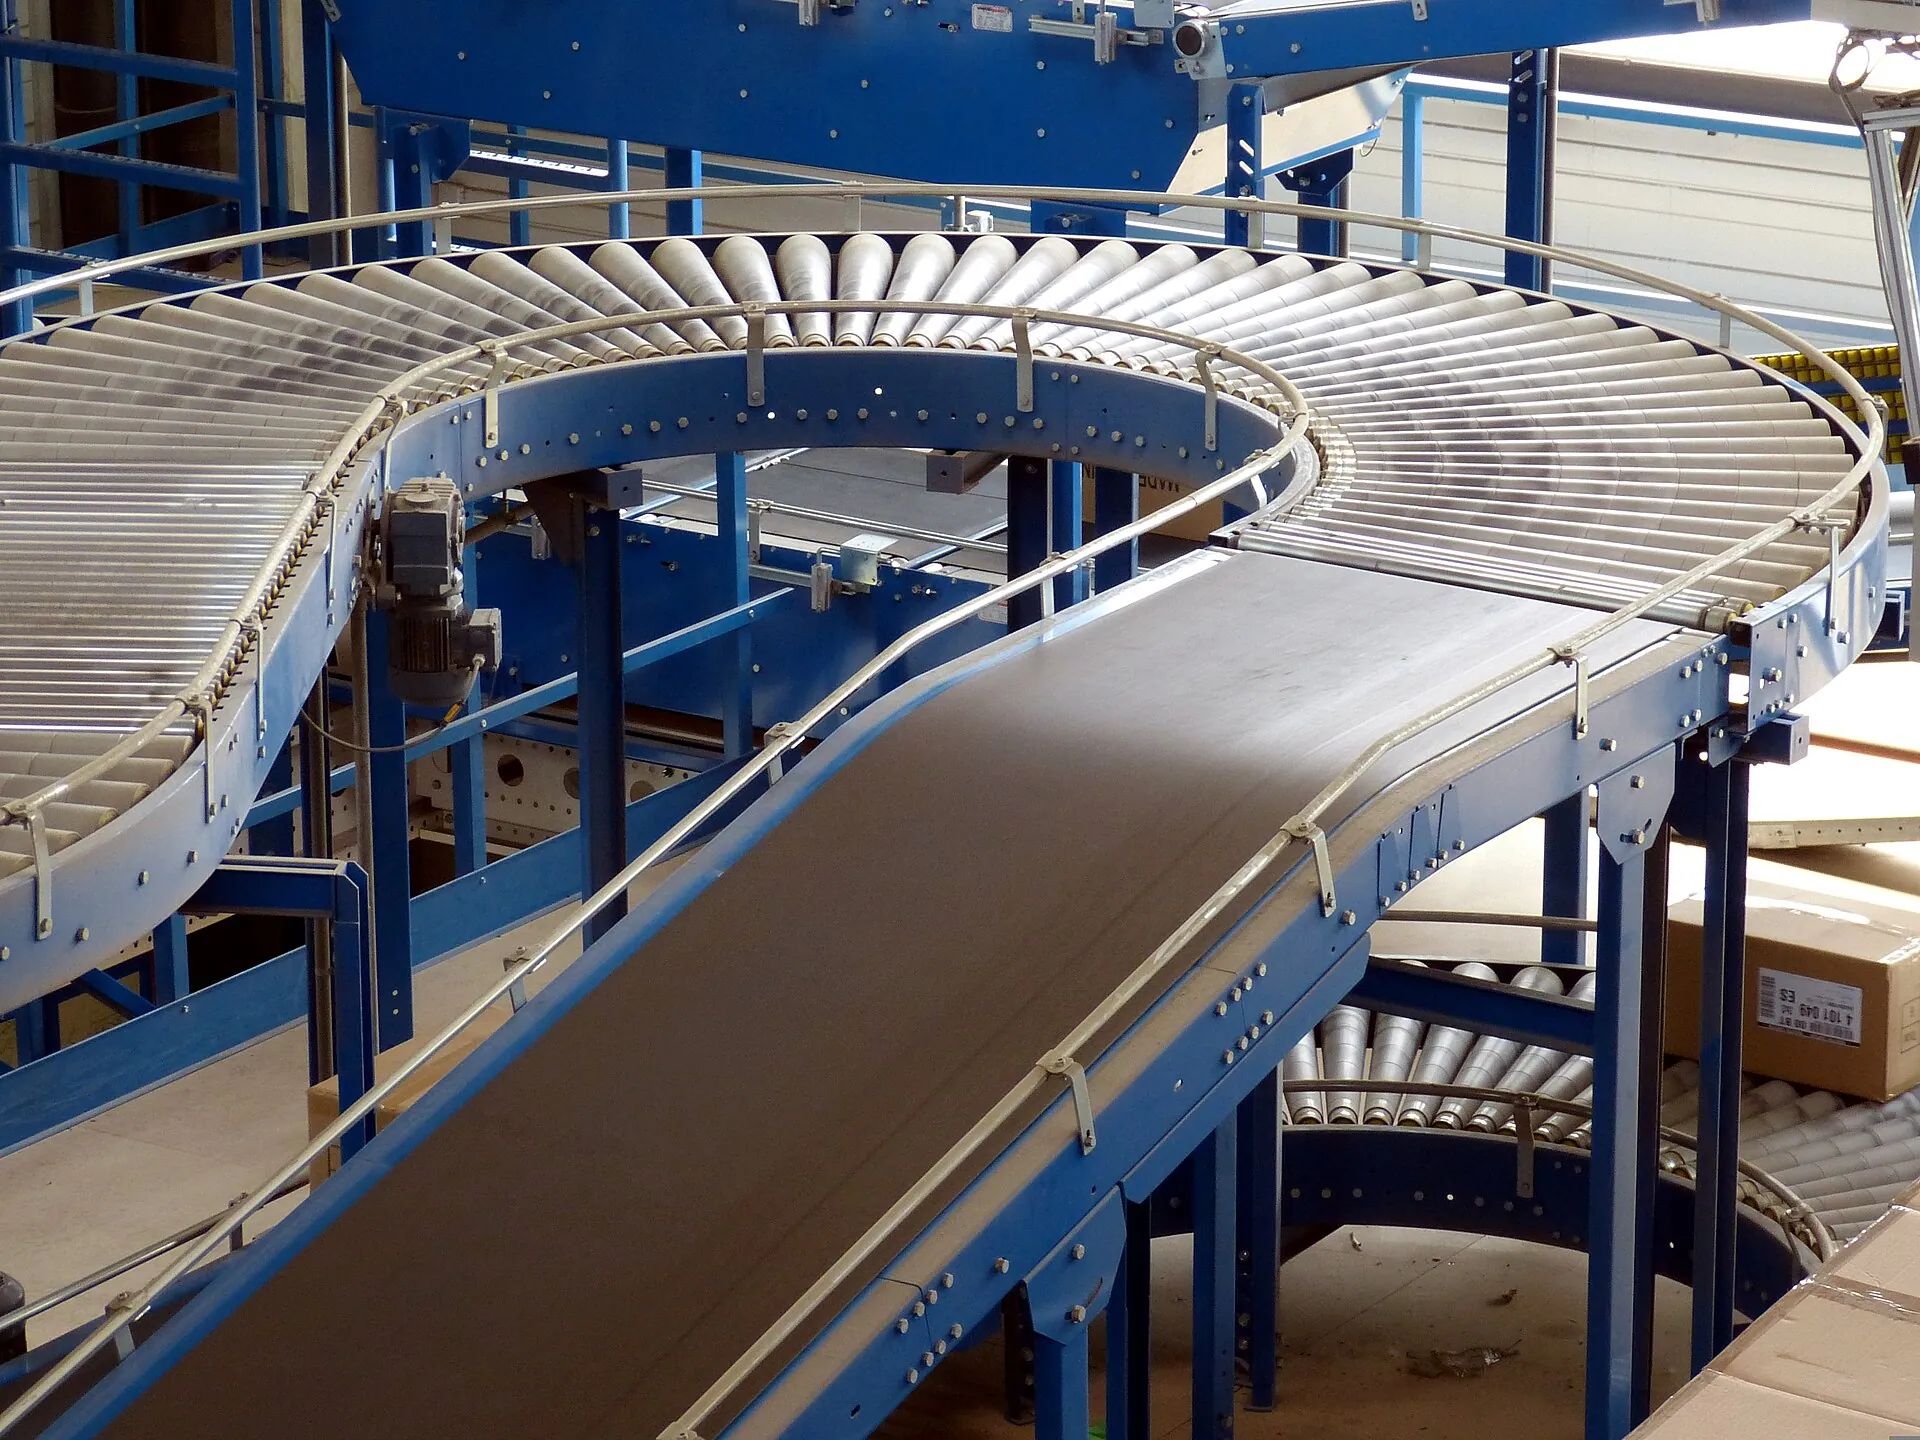
FM's central finding is that loss severity is shaped less by isolated failures than by how systems interact and escalate. Mechanical or electrical breakdown directly accounts for 29 per cent of losses, rising to 53 per cent once structural failures and mobile equipment incidents are included — yet severity concentrates where a defect can travel. A conveyor is built to travel: it combines stored energy, friction heat and continuous duty with a moving combustible path, because belt, linings and cable runs extend the full length of a plant, so a localised failure has somewhere to go. FM notes that fire frequently acts as an escalation mechanism following an initiating failure, and that loss of containment — fuels, hydraulic oil or lubricants escaping — is what often converts an equipment upset into a spreading fire, contamination and extended clean-up. Layout decides much of the rest: the report names congested layouts, combustible exposures, inadequate segregation and single-train dependencies as latent weaknesses that can sit dormant for years before surfacing under stress. And the bill keeps running after the damage is done, because business interruption is increasingly driven by restart complexity — long repair timelines, specialist repair availability and recommissioning — rather than by physical damage alone. That is why an asset class that rarely headlines for breaking carries the largest share of equipment loss value: when a conveyor is involved, the loss escalates along the line.

When losses happen: hot work and the non-routine window
The timing pattern in FM's data is as pointed as the equipment ranking. Loss experience concentrates around transitions and interventions — start-ups, shutdowns, maintenance, recommissioning and recovery from process instability — when systems are least stable, safeguards may be bypassed or degraded, and work is executed under time pressure. Hot work remains a persistent ignition source: cutting, welding and grinding performed near combustible linings, conveyor belts, cable runs, hydraulic systems and polymer-based materials. FM's control bar is explicit: effective control depends on more than permits, and requires task-specific hazard review, isolation, cleaning, supervision and verification before work starts. The report's own case study shows the conveyor as the escalation path in someone else's incident. In the mid-2010s, hot work during nearby maintenance ignited the thick polyurethane lining of a heavy-duty screening unit at a large mining operation; the fire damaged the screen and its supporting structure, for roughly US$5 million in physical damage, but the site's emergency response team contained it before it spread to a critical downstream conveyor serving multiple screening units, which is why the production impact stayed limited. FM's analytics had identified that location's higher loss exposure a year before the fire. For buyers the translation is direct: segregation, access and isolation are decided when the line is specified and purchased — not on the day a contractor arrives with a grinder.
What the weighting should change in a specification
Read as a buyer rather than as an insurer, the report reprices four familiar specification decisions. First, fire exposure becomes a specification axis in its own right. FM advises reviewing the concentration and continuity of combustible materials — particularly around conveyors and processing equipment — and, where layouts cannot be changed, considering targeted detection and fixed protection. In purchase documents that becomes belt fire-performance requirements for enclosed or high-ignition-risk routes, plus explicit questions about the linings, covers and hydraulic runs that sit along the line. Second, criticality ranking follows the loss data: single-train lines with no redundancy are where escalation turns into site interruption, so they are where protection and spares money earns its return first — FM makes the same point at portfolio level, finding that nearly a third of losses originate from just 2 per cent of locations. Third, recovery is bought, not improvised. Contingency planning is one of the seven equipment factors FM scores, explicitly including spares strategy, isolation and access, work execution readiness and credible production workarounds; because restart timelines are governed by spare-part lead times and specialist repair availability, replacement belt lengths, critical drive spares and recommissioning support belong inside the purchase negotiation, priced alongside the line itself. Fourth, maintenance priority follows consequence rather than frequency: FM directs maintenance strategy at the assets whose failure would mean extended downtime, limited redundancy or complex recovery — a ranking most conveyor fleets can build from their own downtime records before the next tender goes out.
Questions the loss table puts to a supplier
Five questions carry the loss data into a vendor review without turning the meeting into an insurance seminar. 1) For each line in the proposal, which single failure produces the longest restart, and what in the offer shortens it? 2) Where the route passes enclosed galleries, transfer towers or areas where hot work is routine, what fire performance does the belt compound carry, what evidence supports the claim, and is that grade priced into the base offer or sold as an extra? 3) Along the route, where do combustible materials concentrate and run continuously — linings, cable runs, hydraulic power packs — and what segregation or protection does the design include at those points? 4) What are today's lead times for a full replacement belt length and for the critical drive components, and which spares does the supplier recommend holding from day one? 5) What does the design provide for safe maintenance windows: isolation points, access for inspection and cleaning, and the interfaces a hot-work permit would need? None of these questions asks a supplier to predict a fire. They ask whether the offer was engineered against the loss mechanisms that twenty years of claims say actually escalate — and a supplier who answers in numbers, lead times and test evidence is pricing risk, not just tonnes per hour.
The boundary: loss statistics here, device specification elsewhere
This article works at the level of loss statistics, and it deliberately stops there. FM's report can show where loss value concentrates, which mechanisms escalate it and when exposure peaks; it does not specify a single protective device, and this piece repeats none of the device-level content of our companion article, Conveyor Safety Devices as One System. That article works one layer down, turning pull cords, alignment switches and belt-damage detectors into one interlocked protection specification, with trip logic and proof testing; a separate article on belt monitoring covers the third layer, condition data as a specification. The division of labour is the point: use the loss data to decide which lines, routes and exposures deserve the protection budget first, then use the device-system specification to decide what that protection consists of. One calibration warning closes the loop. Both 32 per cent figures are shares of loss value inside FM's engineering dataset — not the probability that any given conveyor will fail or catch fire — and they earn their place in a specification as weighting evidence for where the effort pays, not as a forecast for a single installation.
Manufacturer announcements and our analysis are distinguished. Product claims require verification for the specific application.
Sources
Understanding the Mining Industry: Loss Trends and Predictive Analytics ↗FM's own report (document WF692204, Rev. 07/2026), the primary source for all figures used here: an analysis of global mining losses from 2006 to 2026 based on engineering assessments at 300+ mine sites, with about US$2 billion of gross loss in the period. Fire at 32% is the share of total gross loss value by peril; conveyors at 32% is the gross loss share by equipment type, i.e. equipment-related losses by value — both bases are stated explicitly in the report and must not be interchanged. Also the source for the escalation mechanisms, seven equipment factors and fire case.
Tackling the fire hazard to mining resilience ↗Australian Mining's report of 27 October 2026 on the release of FM's study, opened and checked line by line against the FM document: the two 32 per cent figures with their respective bases, the two-decades/300-plus-sites dataset description, the seven equipment factors and the comments of FM account engineering group manager and senior advisor Michael Beaumont. Where the news wording and the report differ, this article follows the report.
Mining — FM ↗FM's mining page, the publisher's entry point for the loss trends and predictive analytics report, checked for this article: it confirms the report's scope — fire, mechanical and electrical breakdowns, geotechnical events and equipment-related failures, drawn from more than 50 years of FM mining loss data — and that FM maintains dedicated conveyor belt fire hazard research and guidance on the fire risk in mining conveyor systems.